In the last post we have an introduction with using Instruments to finding memory leak.
This post, we will use a concrete, and a very common example, where memory is leaking because of retain cycle.
Retain Cycle
A retain cycle happens when object A has a strong reference to B, and B also has a strong reference to A.
This cycle will prevent the memory from releasing, when it should.
You can read more about it from realm.io talk or krakendev.
We will use the example of a view controller (VC) which is having a retain cycle with some other object.
In a normal behaviour, when the VC is pushed and subsequently popped, it’s memory should be released.
How to detect memory leak with deinit
There are a few ways to detect a leak.
A easy way is to make sure deinit is called. When memory is to be released, deinit is always being called.
deinit {
    print("Memory to be released soon")
}
When the VC is popped, you should see the method being called.
How to detect memory leak with Instruments
In the last post we have an introduction. Profile the app with Leaks template.
For this case of finding memory leak for our view controller, it is easier if we configure to record only for objects that has the suffix “ViewController”.
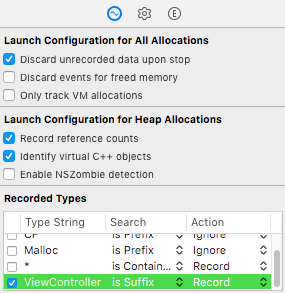
This will record only the relevant objects we are interested in, so it is easier to find what we want.
Record the session, and use the app and push the view controller.
Select All Heap & Anonymous VM, and look under Details > Statistics.
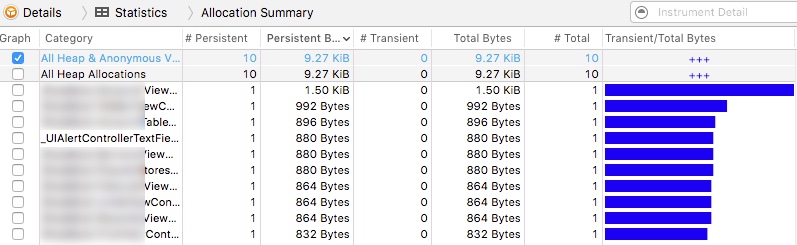
Now pop the view controller, and observe the memory allocation. The popped view controller should no longer be listed. If you still see it, then you have a memory leak!
If you now repeatedly push and pop the leaking VC, then you will see that the # Persistent will increase. That is a count of the number of that object in memory.
Who is retaining me?
To fix the retain cycle, you have to know who is retaining the VC errorneously.
Unfortunately, you’re never going to be able to get a list of objects retaining a certain object. This is because in ARC, an object only record a reference count, a counter on how many objects is referencing to it. To record who is referencing to it will be inefficient.
While you will not be able to find out exactly who is retaining VC immediately, you will be able to deduce by doing some forensic.
Select the VC object in memory, and click on the right arrow button. This will show the Reference Count History, with all the events that retain and release the VC.
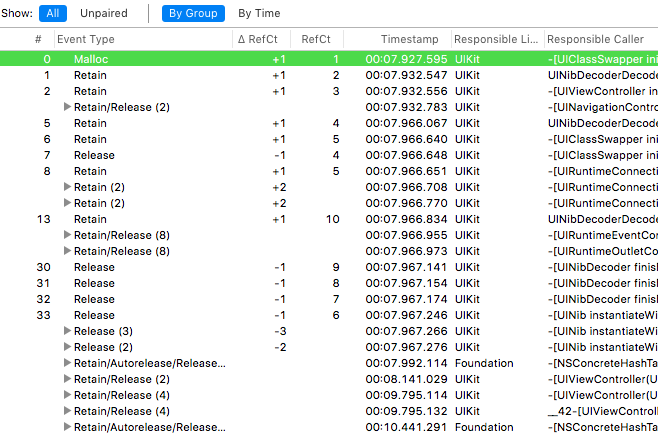
It is up to you to deduce which Responsible Caller is causing the retain cycle. You might want to select a “Retain” and a “Release” and “Pair” them up, and slowly find the extra retain.
Bonus: View Controller - weak delegate
I wrote this post when I was trying to find a memory leak for my view controller.
I guess this will be a pretty common pitfall for view controller. The culprit for my case is a custom delegate I wrote that is a protocol like this:
protocol MyViewControllerDelegate {
}

var delegate: MyViewControllerDelegate?
The fix is to make the delegate object weak, so as to break the reference cycle.
protocol DealCellDelegate: class {
}

weak var delegate: MyViewControllerDelegate?
In doing so, realize that the protocol has a class requirement, as weak cannot be applied to non-class type.