Often, developers do not put much effort into finding memory leak. While technology like ARC and Swift has helped to prevent us from creating memory leak, it is still unavoidable.
Before shipping your app, it is worth profiling your app memory usage to iron out quirky bugs.
Using Instruments
Instruments is a great companion tool to Xcode.
But it could be complex at first, so this guide is to run through how to use Instruments to find potential memory leaks.
1. Profile the App
From Xcode, select Product > Profile.
This will open Instruments.
From Instruments, select Leaks as the profiling template to use.
2. Configure
On the left pane, Record Settings (CMD+1) has a few configurations that should be set for our memory leak investigation.
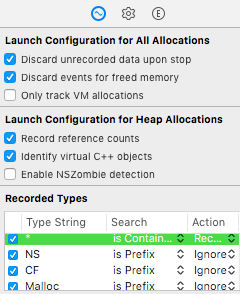
In the above screenshot, we
- enable Discard events for freed memory as we don’t need to record for memory that were freed (we only interested in leaks)
- check the flags in Recorded Types to ignore types with prefixes NS, CF and Malloc, as these are low level functions
3. Start Recording
Click on the red record button on the top left to start profiling the app.
As you use the app, you will see the memory usuage being recorded/snapshotted.
4. Mark Generation
In Display Settings (CMD+2), a very important button is there - Mark Generation
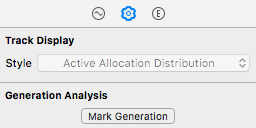
Whenever you press the button, it will mark that period as a new generation.
When you mark 2 generations, eg Generation A and B, then analysing Generation B, it will tell the number of memory objects that persisted since Generation A. This is important for finding leaks.
For example, we mark Generation A at a stable state of the app. Then we use the app and navigate screens, such as pushing view controllers etc, then finally popping back, wait a while for memory to be released, then mark Generation B.
At this stage, Generation B should have # Persistent be zero.
If it is not zero, then it would mean there is a memory leak, and you have to find out why.
5. Analysing Call Tree
Let say Generation B is not zero, hence you need to find which object is leaking memory.
As you drill down Generation B (click on the arrow button to see details), you will see a call tree.
When you are at a call tree, the Display Settings will enabled the options for Call Tree.
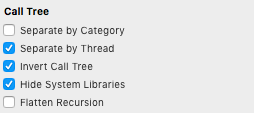
Invert Call Tree and Hide System Libraries makes it easier to find what you are looking for. So is Separate by Thread.
Thereafter, it is up to you to inspect the objects, and your code, and fix the leak.
Other Tips
Perform a static analysis of your code by going to Xcode > Product > Analyze.
What is static analysis?
a collection of algorithms and techniques used to analyze source code in order to automatically find bugs. The idea is similar in spirit to compiler warnings but to take that idea a step further and find bugs that are traditionally found using run-time debugging techniques such as testing.
After Xcode complete the analysis, you can find any flagged issues under Issue Navigator (CMD + 4).
If you ever run into EXC_BAD_ACCESS errors (who doesn’t?), then you would enable Zombie Objects under your scheme > Run > Diagnostics. Enabling the flag will provide a warning when you try to access a deallocated object, instead of simply crashing with EXC_BAD_ACCESS.