I spent an afternoon getting Chrome DevTools MCP working with Claude Code. Made every wrong turn possible. Here’s the right way so you don’t repeat my mistakes.
Why you’d want this
This morning I asked Claude Code to read today’s Business Times for me. The e-paper sits behind an NLB login, rendered in a custom epub reader. No API. No RSS feed. No MCP for SPH’s newspaper platform.
Claude Code opened the tab, found the reader’s internal cciobjects.json endpoint, and pulled every article’s headline, byline, and full text in a single fetch. 35 articles across 8 sections. It picked the 5 most interesting stories and summarized them. Took seconds.
The naive approach (which I tried first) was screenshotting each page. 22 pages, one at a time, reading text from images. Slow, inaccurate, and I only got the top half of each page because I forgot to scroll. The smart approach: inspect the network requests, find the structured data, and fetch it directly. The agent figured this out on its own once I pointed out the screenshots were slow.
That’s the real power here. Not just “AI can click buttons in a browser.” It’s that your agent can access anything you can access, through your logged-in session, and it’s smart enough to find the fastest path to the data.
Paywalled content behind custom viewers. Newspapers, research papers, financial reports. If it renders in your browser, the data is there somewhere. The agent can inspect network traffic, find the underlying API, and extract structured text instead of OCR-ing screenshots.
Portals that will never have an API. Your landlord’s maintenance form. Government permit applications. That procurement system from 2009. One HN commenter nailed it: “This is to automate ticket submission to my landlord’s half-baked web portal.”
Reverse-engineering undocumented APIs. The agent navigates using your browser’s auth cookies, intercepts requests, and maps the real API surface. The e-paper example is exactly this: it found a clean JSON endpoint that the reader uses internally, then used it directly.
Verifying what your code actually renders. Your AI writes a CSS fix. Does it work? It reloads the page, inspects computed styles, takes a screenshot. No API tells you your flexbox container is inexplicably 5000px wide. Only the browser knows.
The pattern: browser access is irreplaceable when the content is behind auth, the interface is the only way in, or the rendered output IS the thing you care about.
Setup: the right way
3 steps. 2 minutes.
1. Install the full plugin
Don’t use claude mcp add. The full plugin gives you the MCP server plus 6 skills (a11y auditing, performance debugging, troubleshooting, etc).
claude plugin marketplace add ChromeDevTools/chrome-devtools-mcp
claude plugin install chrome-devtools-mcp
2. Enable --autoConnect
By default, the plugin launches its own Chrome. You don’t want that. You want your real browser with all your tabs and logins.
Edit the plugin config:
vim ~/.claude/plugins/cache/claude-plugins-official/chrome-devtools-mcp/latest/.claude-plugin/plugin.json
Add --autoConnect:
{
  "mcpServers": {
    "chrome-devtools": {
      "command": "npx",
      "args": ["chrome-devtools-mcp@latest", "--autoConnect"]
    }
  }
}
Requires Chrome 144+. You’re probably already there.
3. Enable remote debugging in Chrome
Navigate to chrome://inspect/#remote-debugging and check “Enable remote debugging”.
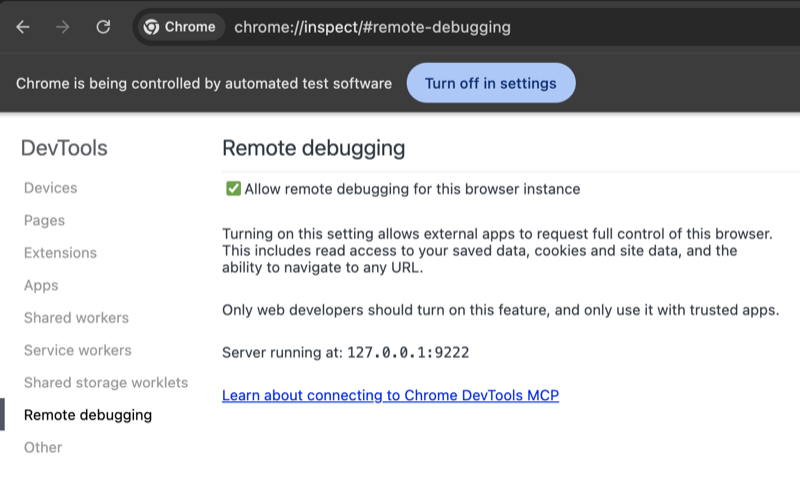
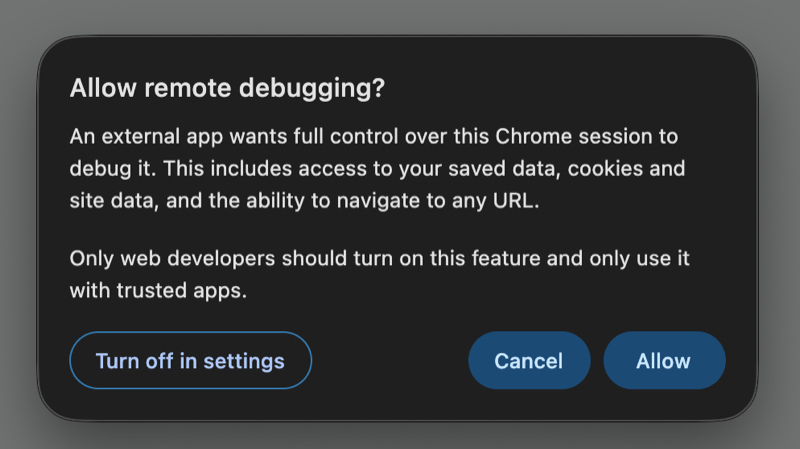
Chrome asks you to confirm. Click Allow.
Restart Claude Code. Verify with list_pages, it should show all your open tabs.
One caveat: the --autoConnect edit lives in the plugin cache. Plugin updates might overwrite it. One-line fix if that happens, but not ideal.
How it works
The MCP uses Chrome DevTools Protocol to talk to your browser. With --autoConnect, it finds your running Chrome directly. No special launch flags.
Claude Code gets a set of tools: list_pages, select_page, navigate_page, take_snapshot, take_screenshot, click, fill, evaluate_script. It switches tabs, reads page content via the accessibility tree, captures network requests, runs JavaScript.
The workflow: navigate, wait, snapshot (text-based, faster than screenshots), interact using element IDs.
The scenic route (what not to do)
Here’s what I actually did before figuring this out.
Mistake 1: MCP-only install
claude mcp add chrome-devtools npx chrome-devtools-mcp@latest
This skips the skills. The troubleshooting skill alone would’ve saved me an hour. Use the full plugin.
Mistake 2: The --remote-debugging-port rabbit hole
Without --autoConnect, the MCP launches its own Chrome. I saw a single about:blank tab and panicked. Down the rabbit hole of launching Chrome from terminal:
/Applications/Google\ Chrome.app/Contents/MacOS/Google\ Chrome --remote-debugging-port=9222
Chrome won’t enable this on your default profile:
DevTools remote debugging requires a non-default data directory.
So you need --user-data-dir pointing somewhere else. Fresh profile, no logins, no cookies. Terrible.
Mistake 3: Copying the entire Chrome profile
I actually ran this:
cp -r ~/Library/Application\ Support/Google/Chrome ~/Library/Application\ Support/Google/Chrome-Debug
It worked. Technically. But it’s a snapshot that drifts from your real profile immediately. And you have to launch Chrome from terminal every time with the right flags.
The whole thing felt off. Because --autoConnect exists and none of this was necessary.
Mistake 4: Not reading the docs
The biggest one. npx chrome-devtools-mcp@latest --help would’ve shown me --autoConnect immediately. The plugin’s troubleshooting skill existed for exactly this situaton.
Read the docs first. Always.
(I say this knowing I won’t follow my own advice next time.)
Or use the right skills.