Improving app launch time is an evergreen topic, with Apple sharing tips since the first iOS SDK. Overtime, the techniques will change. I was looking at it again, after many years, and there are many new things worth sharing.
DYLD_PRINT_STATISTICS no longer works
We used to add the environment variable DYLD_PRINT_STATISTICS to print the durations for dylib loading, initializer etc. But things have changed, maybe with parallel optimizations, so those statistics have become irrelevant.
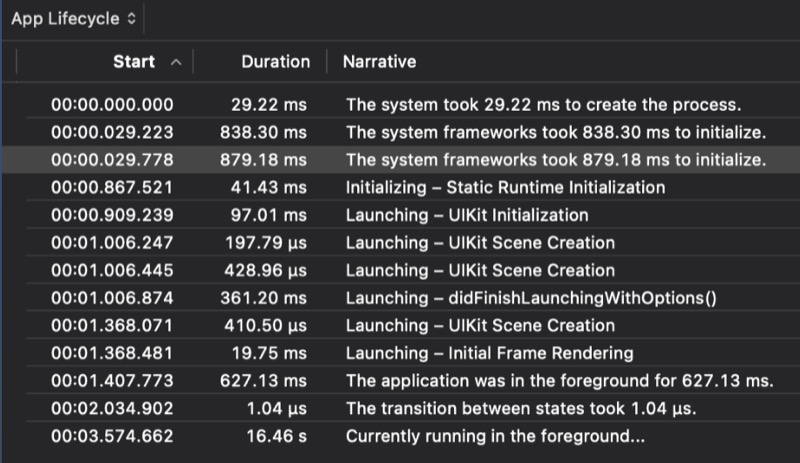
The new way is to use Instrument profiling, and it will visualize the launch along with build durations.


It is a big step forward, where you can see all the static initializers, your method calls, and how long they spent running.
How to use Instruments
Simply use the template App Launch. I will not explain further.
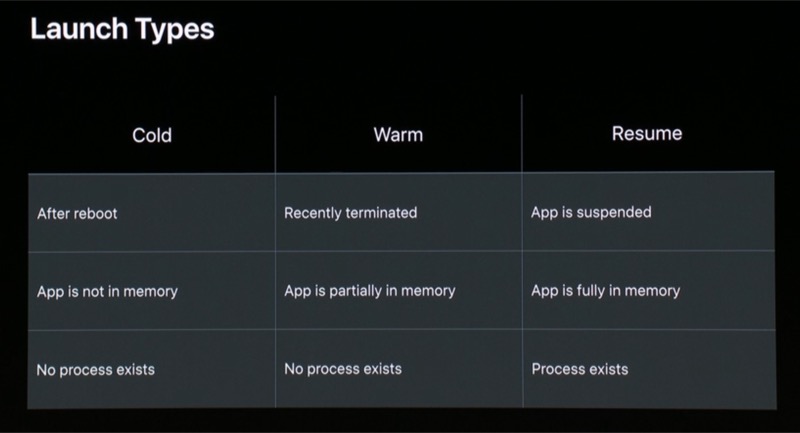
In WWDC 2019, it was covered nicely, along with how we should measure launches consistently. There are 3 launch types to note.

It is fundamental to know cold vs warm, because you need to measure improvements consistently. Obviously, a cold launch is slower than a warm launch, so don’t compare 🍎 to 🍊 or 🤖
Understanding static vs dynamic linking
In WWDC 2022, they explained the history. Static was introduced in the 70s, while dynamic in 90s. It’s that old.
I will also not dive further, because I can never grasp the differences. Vadim Bulavin has a good writeup. Usually, static linking will improve your app launch time. For example, Firebase recommends it:
use_frameworks! :linkage => :static
By default, CocoaPods uses dynamic linkage.
Reducing static initializer calls
Objective-C has a load() method that runs once when a class is loaded. Too many of that, and you will have a performance hit.
But if you’re using pure Swift, you don’t have such issue.
Build & profile for release
Make sure you are building, running and profiling with the release build; use the release build config (instead of debug). This is because release build config will have optimizations and will not include debugging stuff.
In your scheme, disable diagnostics such as Main Thread Checker and Zombie Objects.
On your device, enable airplane mode.
Measure with automated testing & regression
Other than using Instrument to measure app launch, you can also create XCTest to measure app launches repeatedly.
Create a new target of type UI Testing Bundle, and the template code includes the following:
func testLaunchPerformance() throws {
    // This measures how long it takes to launch your application.
    measure(metrics: [XCTApplicationLaunchMetric(waitUntilResponsive: true)]) {
        XCUIApplication().launch()
    }
}
I actually updated the template code to the newer XCTApplicationLaunchMetric(waitUntilResponsive:) which will wait until it is responsive.

Note that the test case is measuring 5 warm launches.
You can even set a baseline, and if the test case runs slower than that, it will fail! Regression no more 🤘🏻 (theorectically)
Measure for real
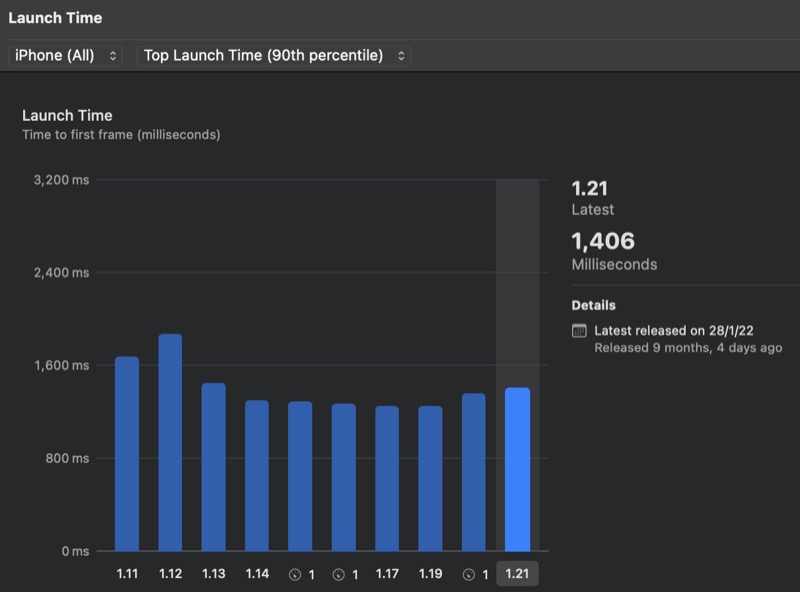
In Xcode > Organizer, Apple now provides the Launch Time metric for your app, measured for each version!
Our ultimate goal is to reduce that duration, usually for the 90% percentile.

You should try to make 1 change at a time, release, then watch the real metrics.
Alternatively, Firebase Performance also measure app launch time, along with network latecy and load.
Resources
- Apple actually has a comprehensive article